Make sure you've set up your Civic.ly account — you need access to the web app to use the map.
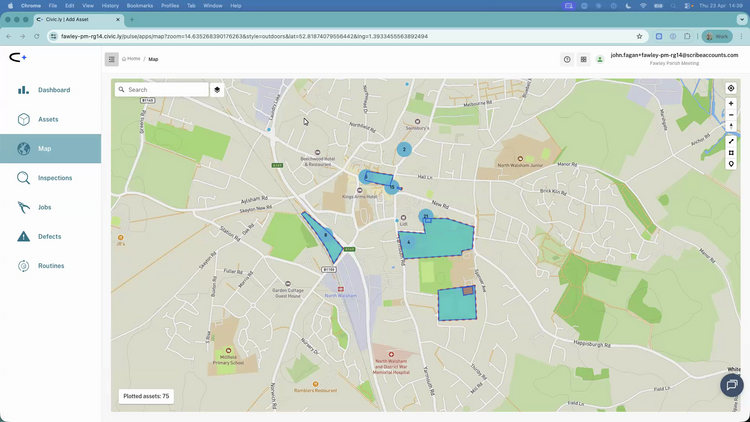
The map is where you see all your council's assets and areas plotted geographically. You can use it to explore what you own, find specific locations, switch between different map layers, filter what's displayed, and access the drawing tools for creating areas. This article gives you a quick tour of the map interface and what you can do with it.
To open the map, click Map in the left-hand menu.
Getting Around the Map
The map works like Google Maps — you will feel at home straight away. You can drag to pan around, scroll to zoom in and out, and use the zoom controls on the right-hand side.
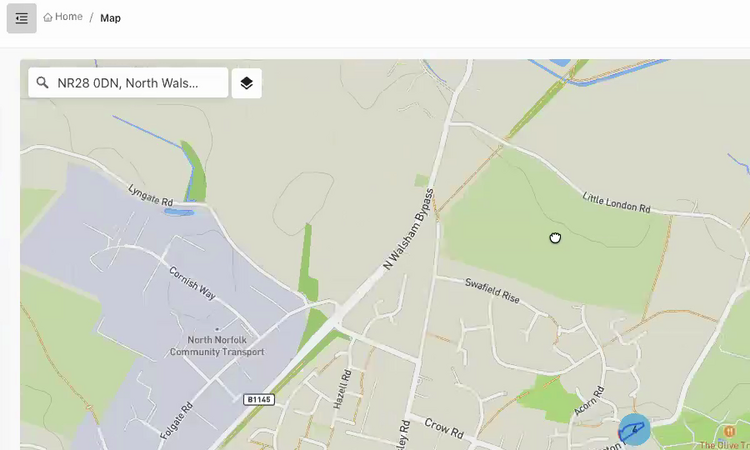
Searching for a location. Use the search bar at the top of the map to jump to any location. This searches for addresses, not your assets — so type a postcode, a street name, or a place name and the map will zoom to that location. This is particularly handy when a resident reports an issue and you need to find the spot quickly.
Sharing a view with a colleague. As you pan and zoom around the map, the URL in your browser updates automatically to reflect where you are. That means you can copy the address from the browser bar and paste it into an email or message — when your colleague opens it, their map will centre on exactly the same spot.
Viewing Asset Details
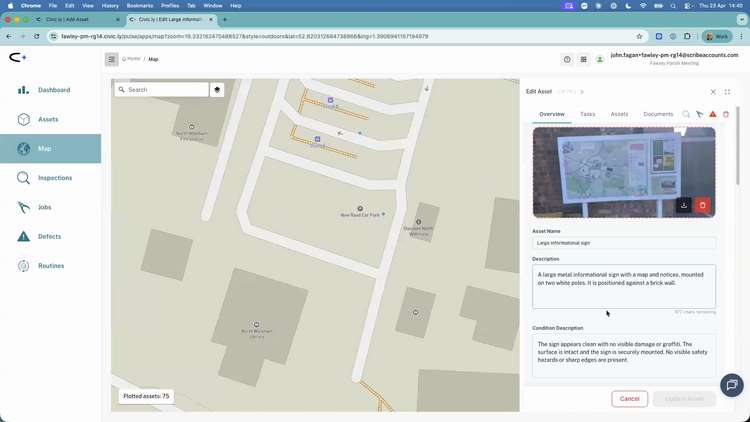
Your assets appear on the map as coloured markers for points and shaded shapes for areas. Hover over any marker or area to see a quick preview with the asset's photo. Double-click to open the full asset details in the side drawer on the right, where you can view and edit the record, see its inspection history, and raise jobs or defects. Changes you make in the side drawer are saved straight to the asset.
Layer Controls — Basemap and Filtering
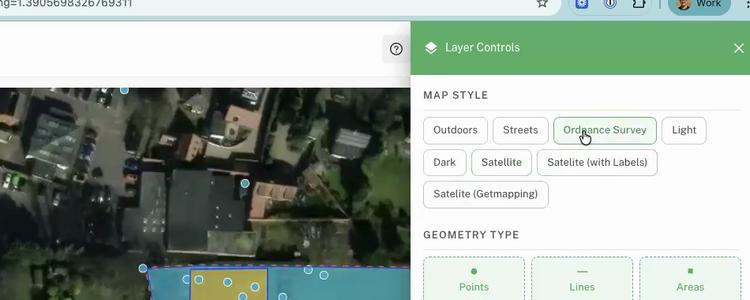
Everything to do with what the map looks like and what's displayed on it lives in the Layer Controls panel on the right-hand side. Click the layer-controls icon to open it — inside, you'll find three sections.
Map Style switches the basemap. The most commonly used options are:
- Outdoors — the default style, good for general use with terrain detail.
- Satellite — aerial photography, useful for identifying features on the ground.
- Ordnance Survey — detailed OS Master Map data showing building outlines, plot boundaries, and land parcels. This layer only becomes available when you zoom in close enough, and it takes a moment to load because it comes from a different server. Very useful for drawing accurate area boundaries.
- GetMapping satellite — an alternative satellite imagery source. Sometimes one provider has clearer or more recent images than the other, so it is worth checking both.
Streets, Light, and Dark styles are also available if you prefer a cleaner look.
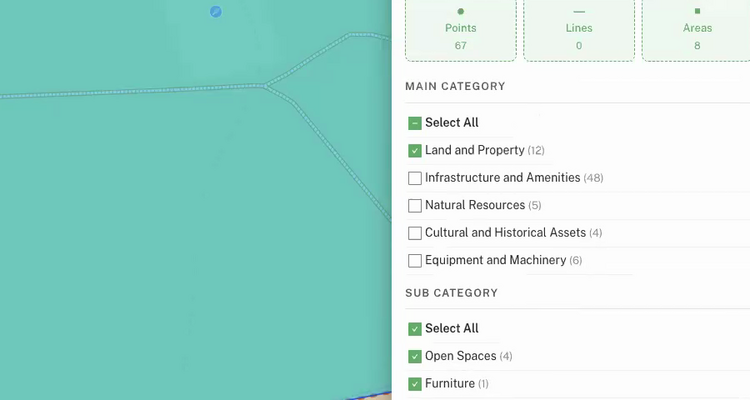
Geometry Type lets you turn assets on and off by shape. Toggle Points, Lines, or Areas to declutter the map — for example, turn off Areas to see just the individual assets underneath, or turn off Points to focus on the area boundaries.
Main Category and Sub Category let you filter by what the asset is. There are six main categories (Infrastructure and Amenities, Land and Property, Equipment and Machinery, Natural Resources, Records and Information, and Cultural and Historical Assets), and each shows an asset count next to it. The panel only shows categories you actually have data for — so if nothing in your register falls under Cultural and Historical Assets yet, that category won't appear at all. Tick a main category to reveal its sub-categories below, so you can drill down to just "Fitness Equipment" or just "Play Equipment" if you want.
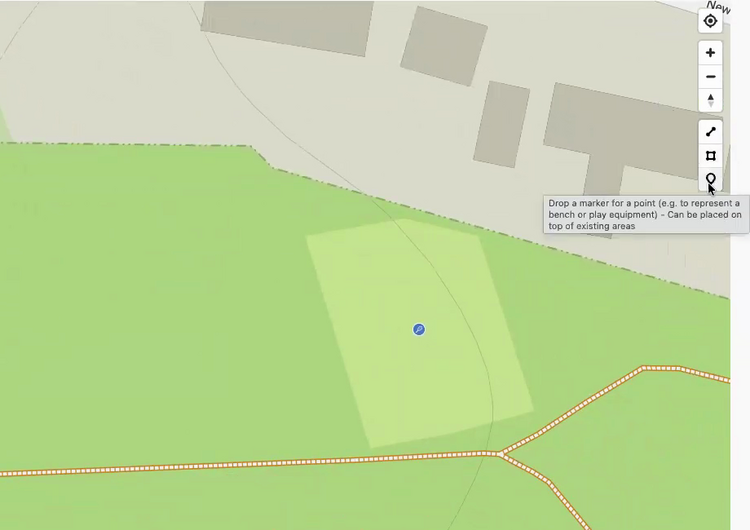
Drawing Tools
On the right-hand side of the map, below the zoom controls, you'll see icons for the drawing tools. These let you create areas (polygons for parks, tennis courts, and the like), lines (for paths, hedgerows, and fencing), and point markers directly on the map. For a full guide to drawing areas, see How to Create and Edit Areas on the Map.
Common Questions
The Ordnance Survey layer only appears when you are zoomed in far enough. Zoom in closer and the option will become available under Map Style in Layer Controls.
Layer Controls only shows main categories and sub-categories that you have data for. If nothing in your asset register falls under that category yet, it won't appear in the list. Add an asset of that type and the category will show up.
Yes. The URL in your browser updates as you pan and zoom, so once you've found the spot you want to share, copy the address out of the browser bar and paste it into an email or message. When they open the link (and log in to Civic.ly), their map will centre on the same location.
Open the Map, type the resident's postcode or street name into the search bar, and the map will jump to that location. Switch to Satellite view in Layer Controls if you need to match what they are describing to what you can see on the ground. From there you can find the asset and raise a defect or create a job.
The full map with Layer Controls, drawing tools, and basemap switching is designed for the web app (in a browser on a computer or tablet). The mobile app shows assets on a map for fieldwork, but the detailed map management features are best used on a larger screen.
What3Words divides the world into 3m × 3m squares, each with a unique three-word label. Civic.ly automatically assigns a What3Words address to every asset when it is uploaded. This is included because many councils find it useful, but you do not need to use it — the app already has the latitude and longitude coordinate and integrates with Google Maps and Apple Maps for directions. Civic.ly covers the What3Words licence cost, so there is nothing extra to pay.