Make sure you've set up your Civic.ly account — you need access to the web app to use the map.
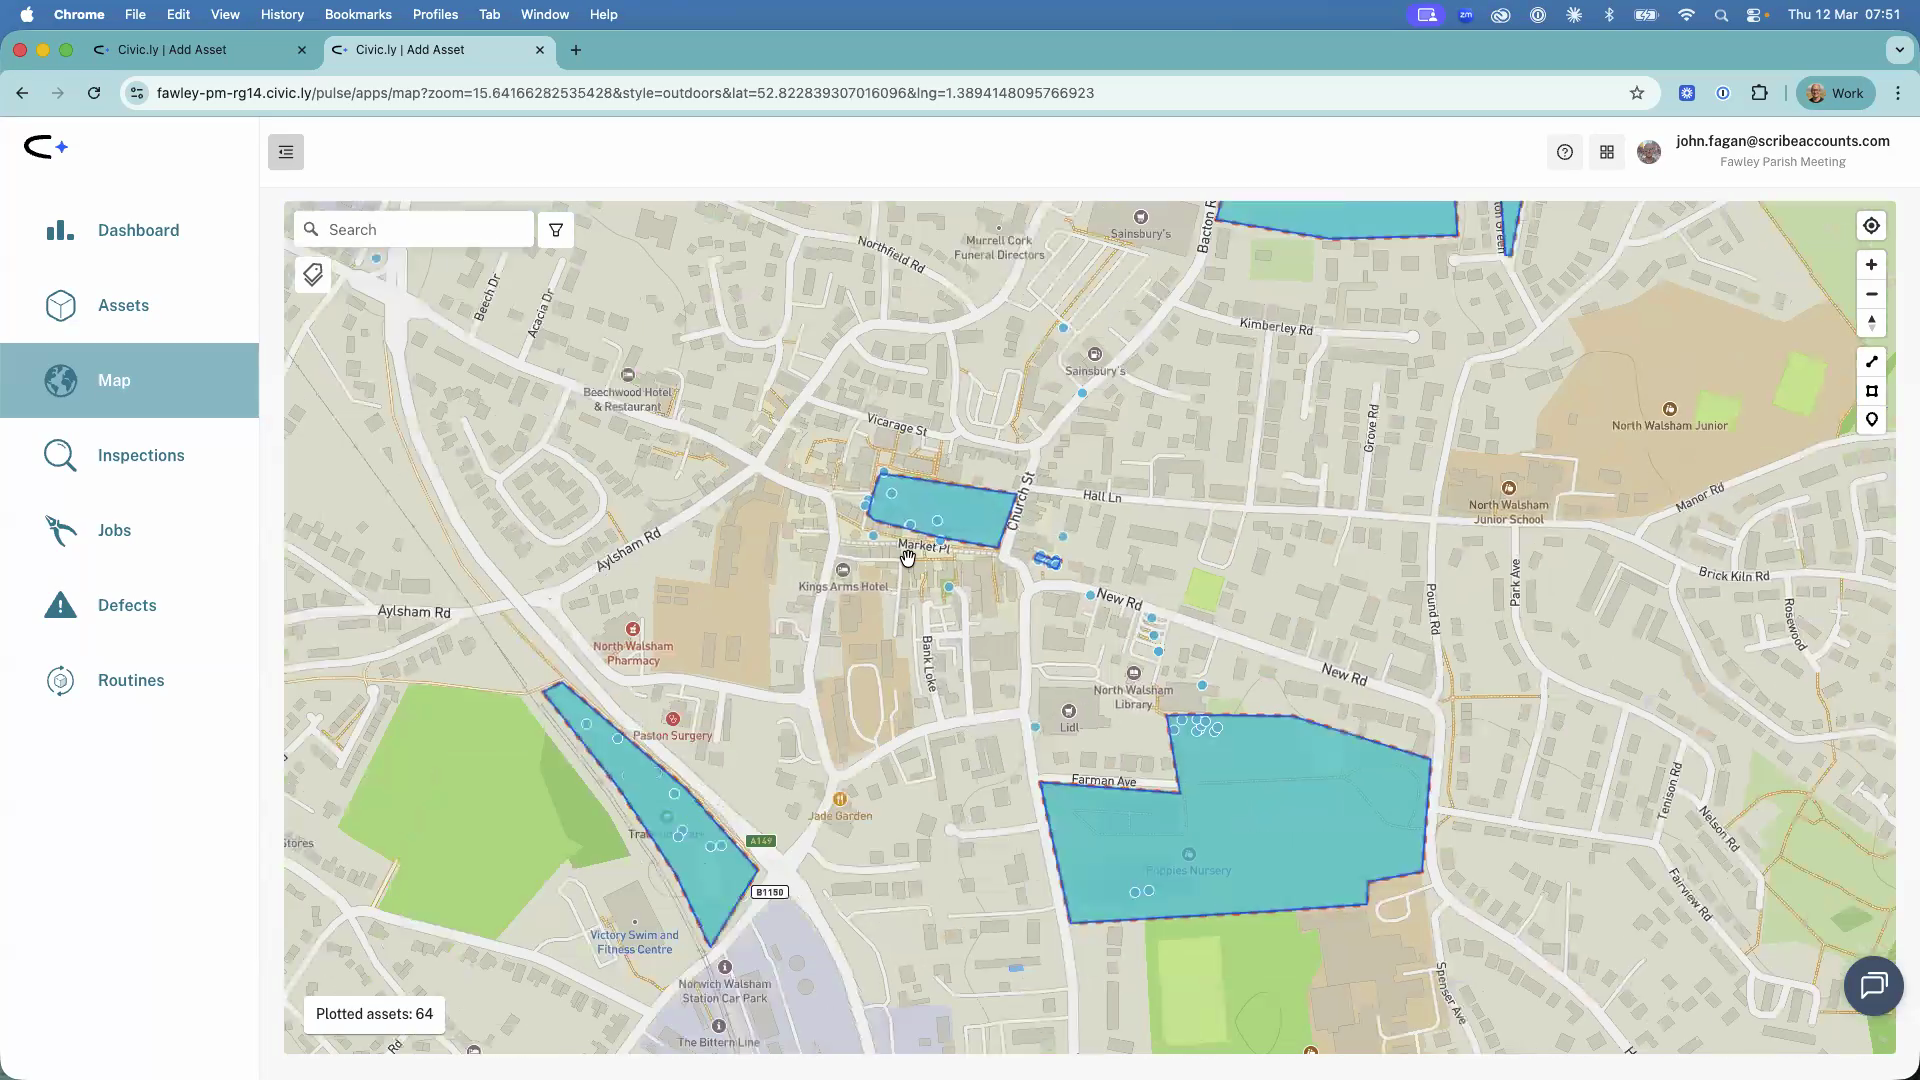
The map is where you see all your council's assets and areas plotted geographically. You can use it to explore what you own, find specific locations, switch between different map layers, and access the drawing tools for creating areas. This article gives you a quick tour of the map interface and what you can do with it.
To open the map, click Map in the left-hand menu.
Getting Around the Map
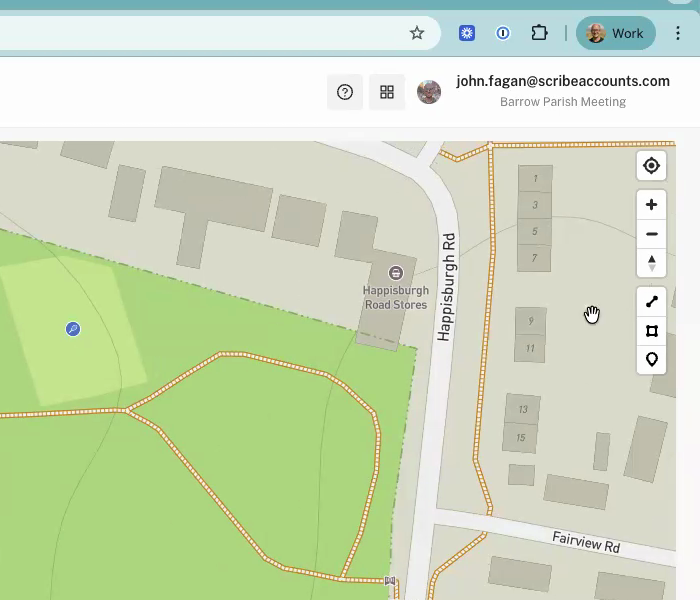
The map works like Google Maps — you will feel at home straight away. You can drag to move around, scroll to zoom in and out, and use the zoom controls on the right-hand side. There is also a Find my location button that centres the map on your current position (your browser will ask for permission the first time).
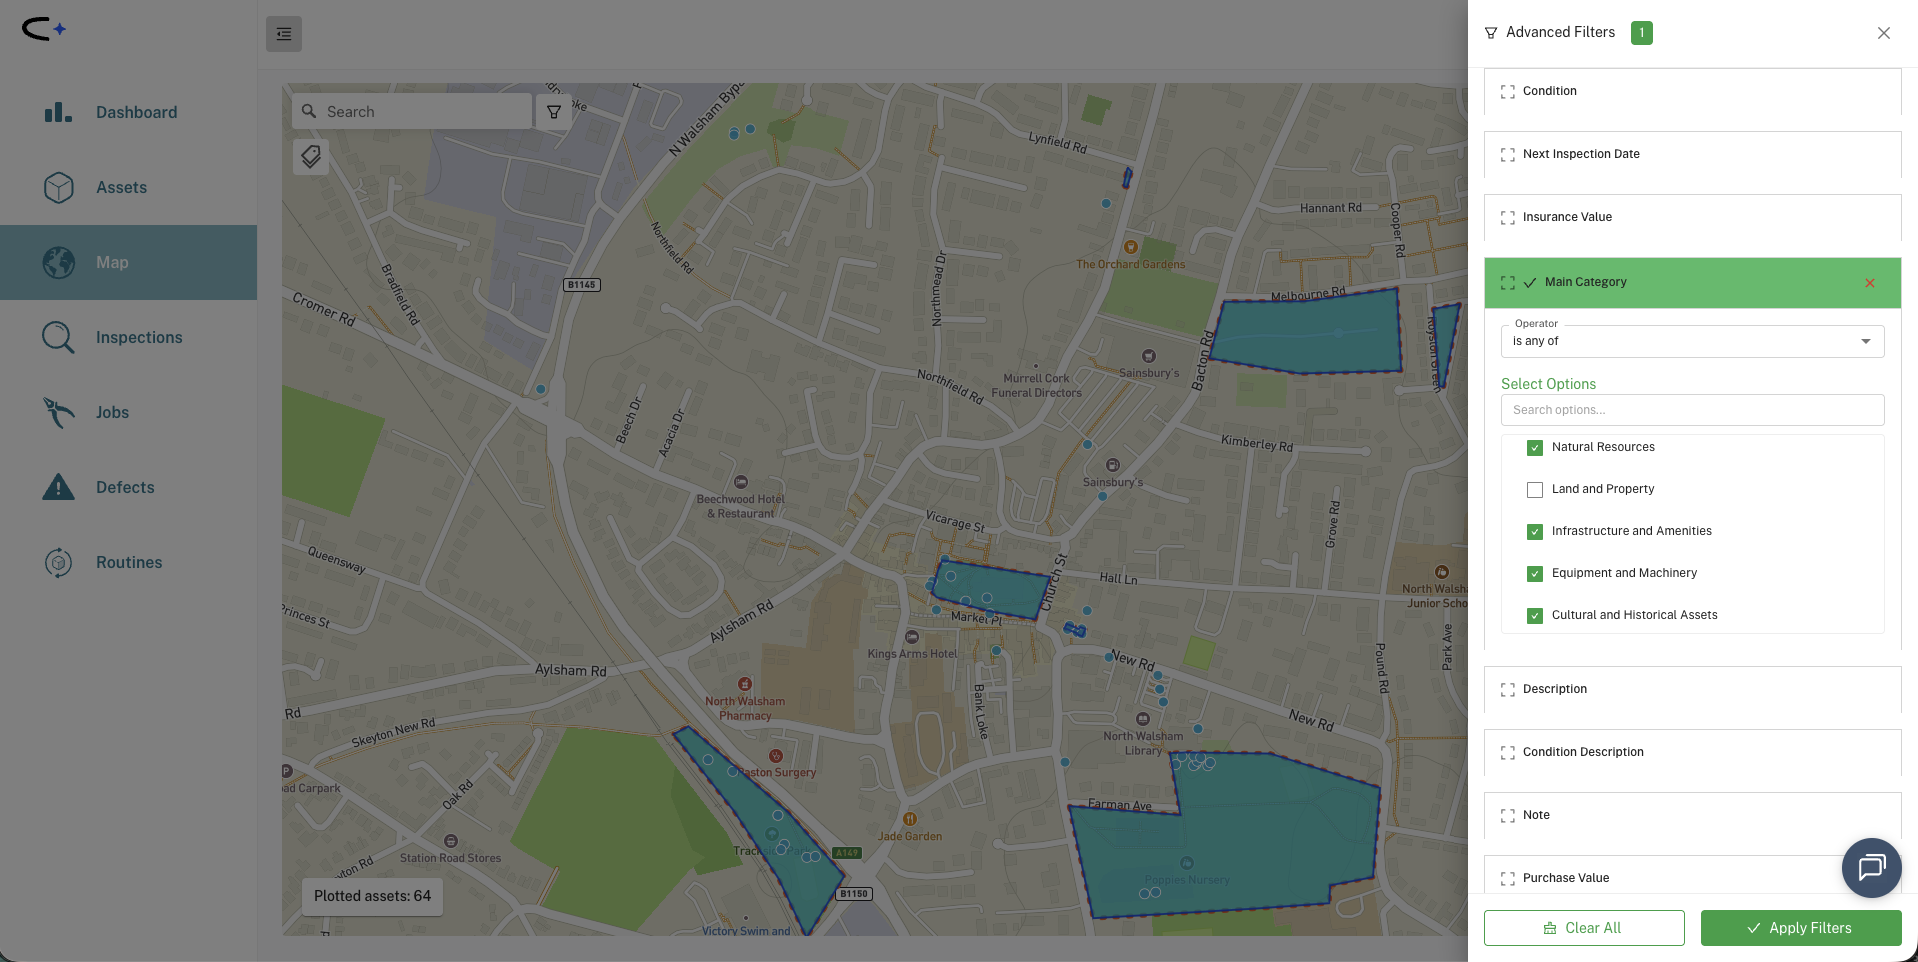
Filtering What You See
If you have a lot of assets and the map feels cluttered, use the Filter button (the funnel icon near the top of the map) to narrow down what is displayed. You can filter by category, status, condition, or area — so if you only want to see playground equipment, or only assets in poor condition, the filter makes that easy.
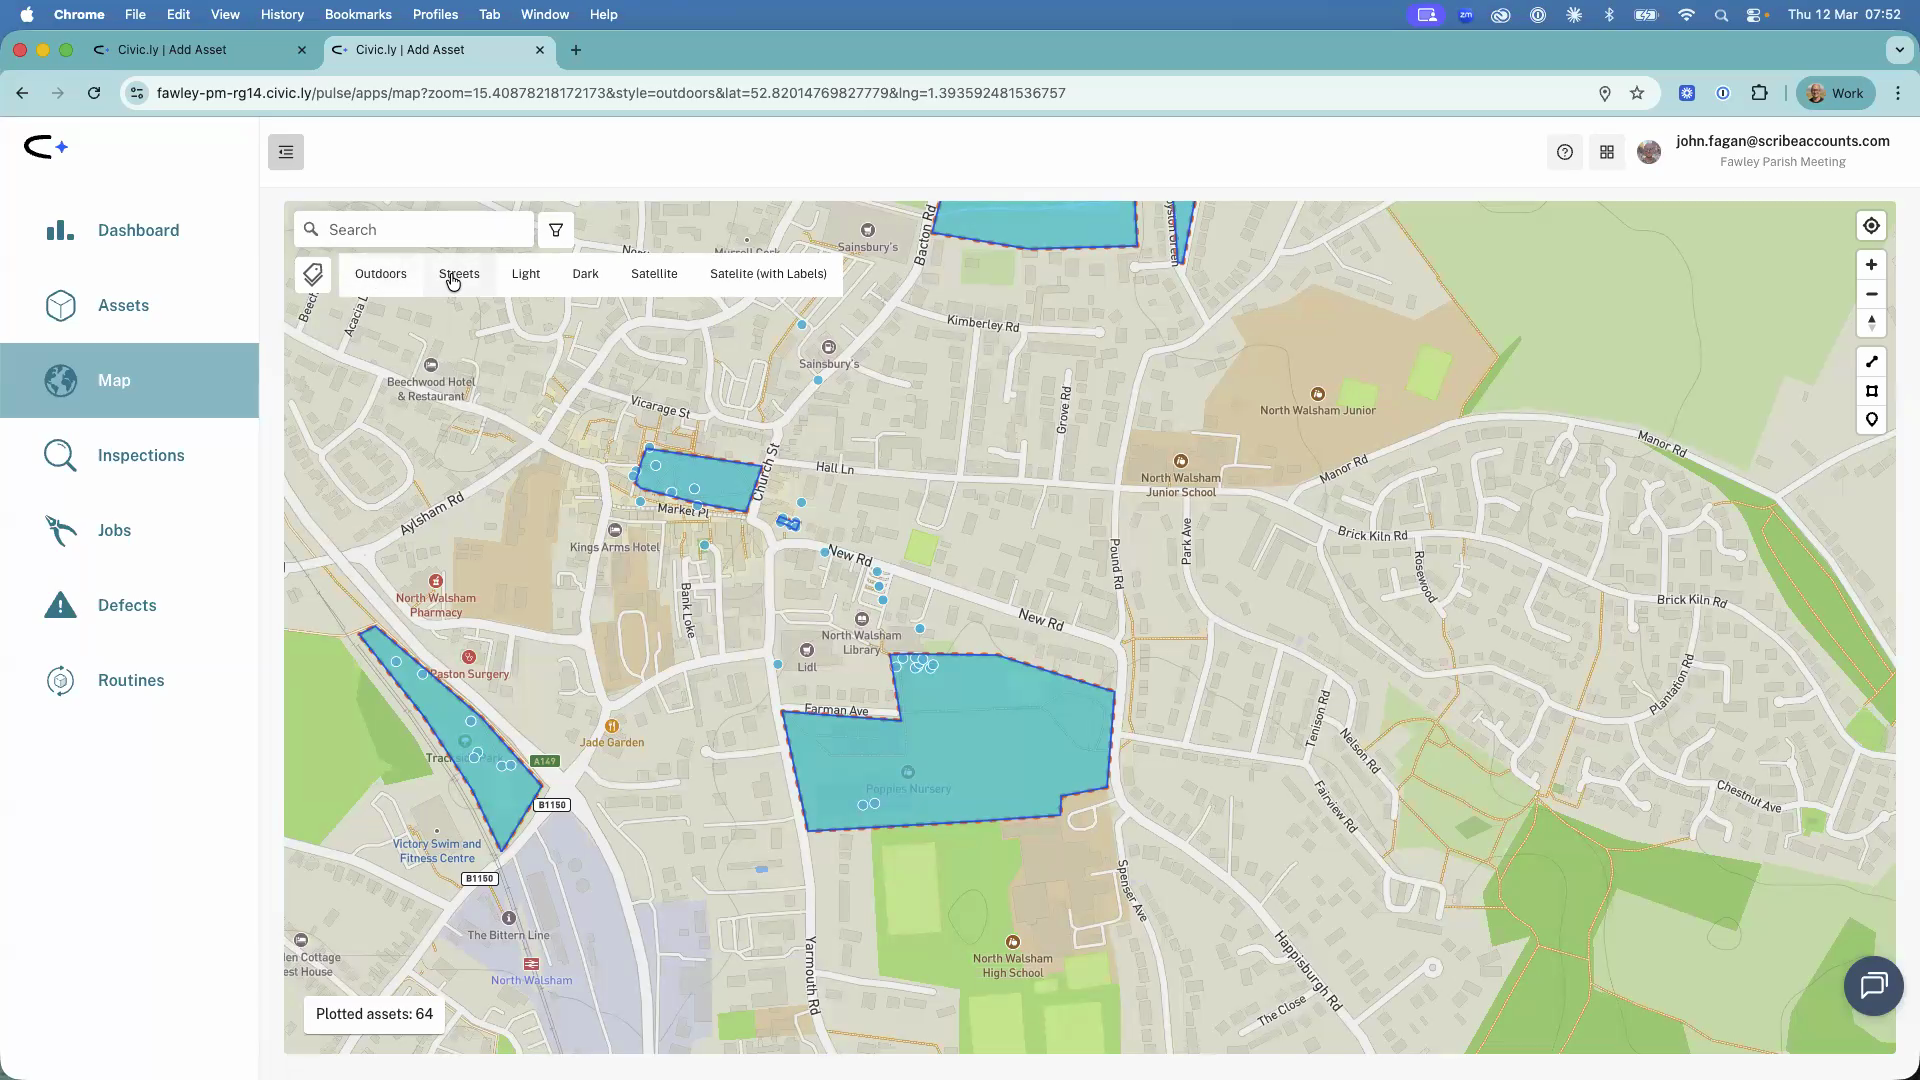
Changing the Map Style
Click the Map styles button (next to the filter) to switch between different map layers. The options are:
- Outdoors — the default style, good for general use with terrain detail.
- Streets — a cleaner road-focused view.
- Light and Dark — simplified styles that make asset pins stand out.
- Satellite — aerial photography, useful for identifying features on the ground.
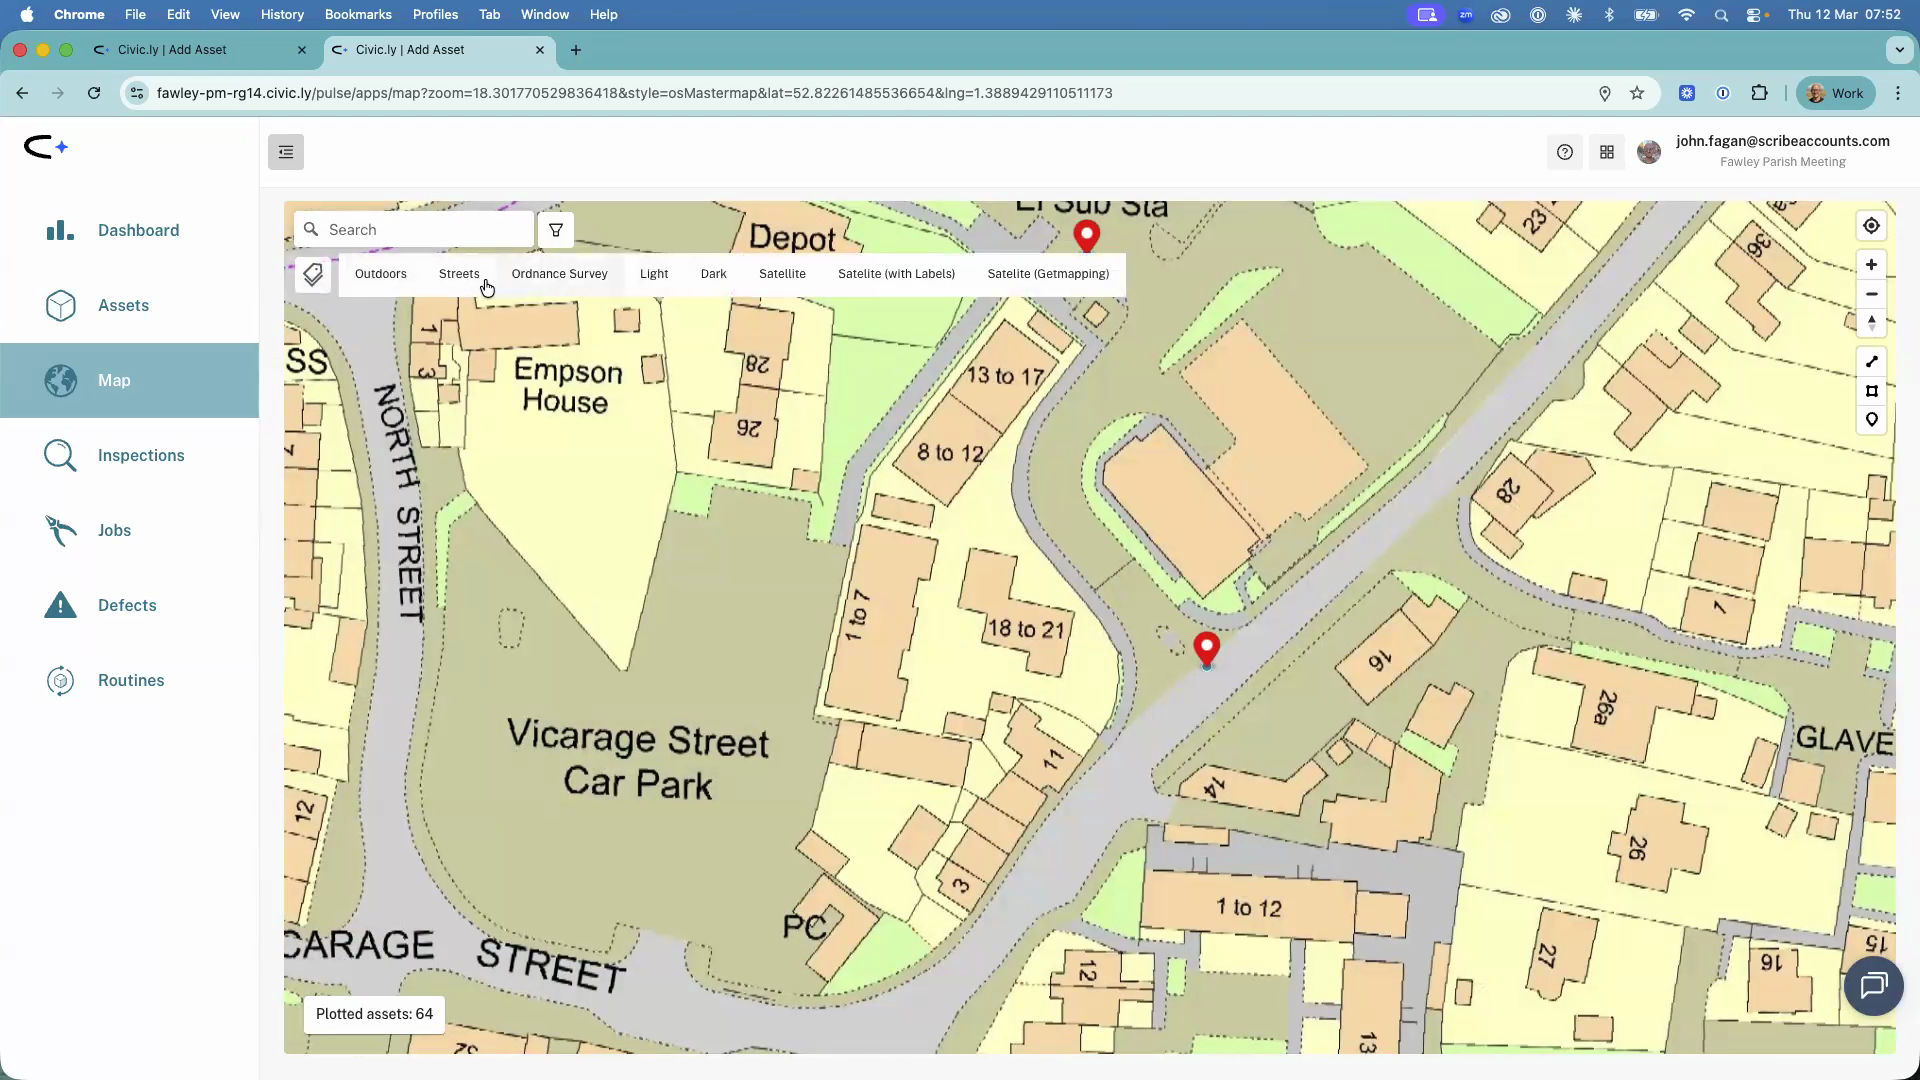
- Ordnance Survey — detailed OS Master Map data showing precise building outlines, plot boundaries, and land parcels. This layer only becomes available when you zoom in close enough. It takes a moment to load but is very useful for drawing accurate area boundaries.
- GetMapping satellite — an alternative satellite imagery source. Sometimes one provider has clearer or more recent images than the other, so it is worth checking both.
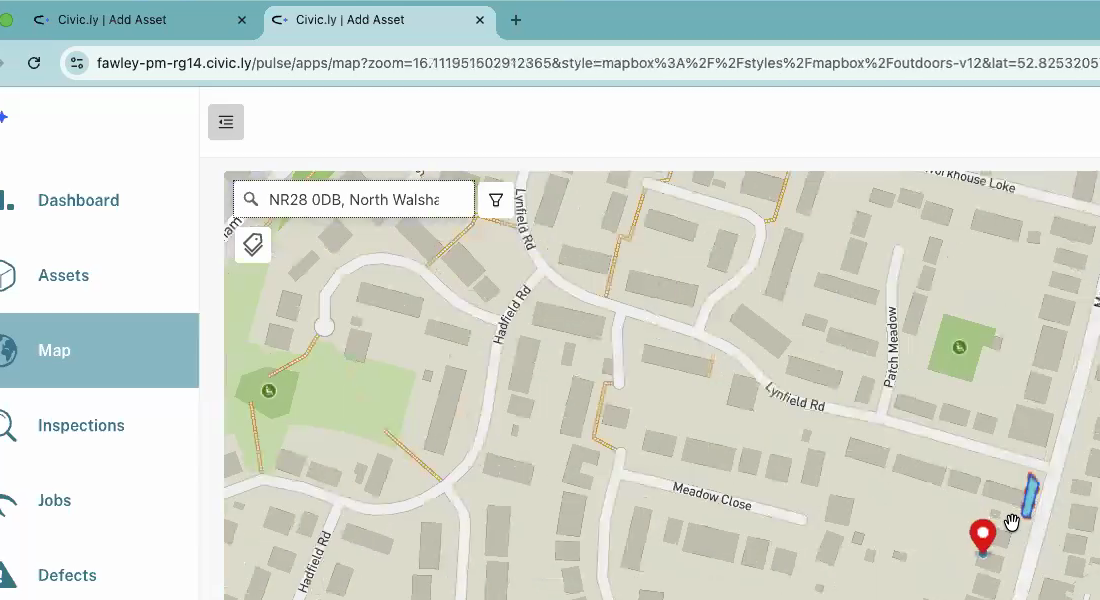
Searching for a Location
Use the search bar at the top of the map to jump to any location. You can type a postcode, a street name, or even a place name. This is particularly handy when a resident reports an issue and you need to find the spot quickly — type in their postcode, switch to satellite view to orientate yourself, and then find the nearest asset or create a job or defect.
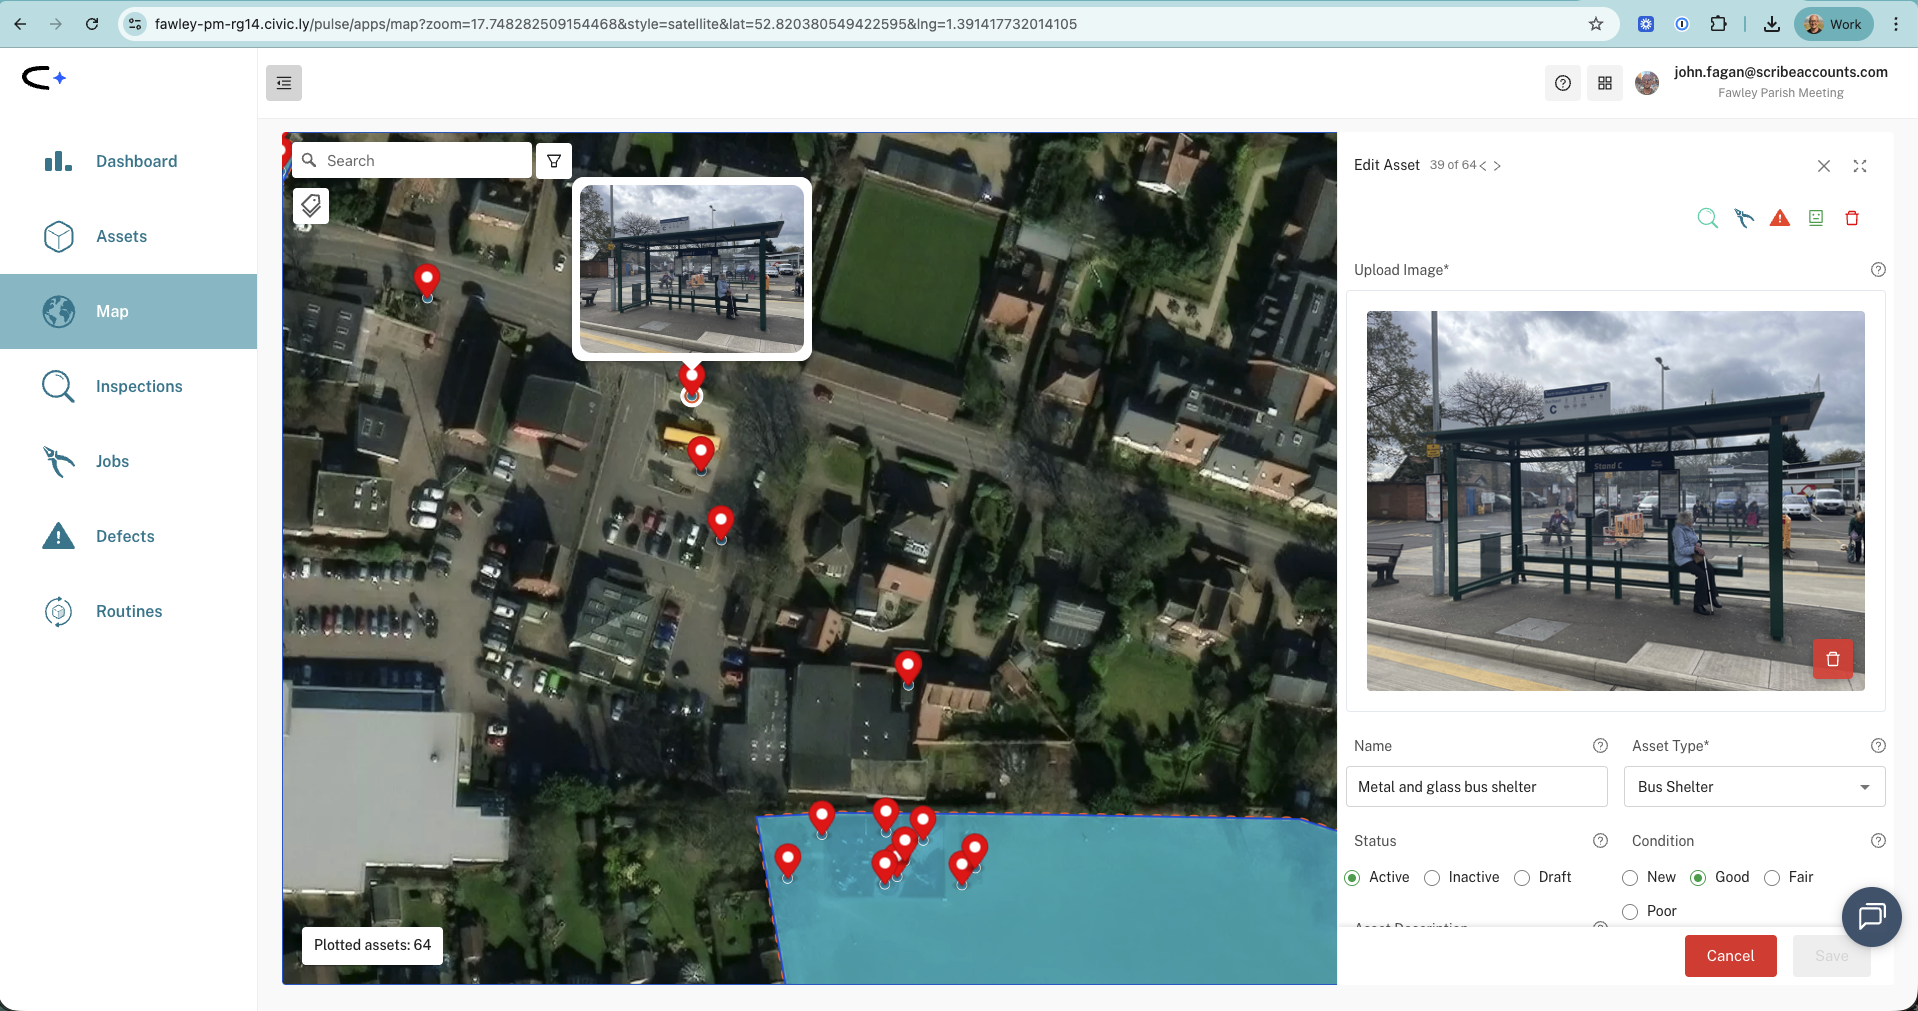
Viewing Asset Details
Hover over any marker or area on the map to see a quick preview with the asset's photo. Double-click on a marker or area to open the full asset details in the side drawer on the right, where you can view and edit the record, see its inspection history, and raise jobs or defects.
Drawing Tools
On the right-hand side of the map, below the zoom controls, you will see icons for the drawing tools. These let you create areas (polygons), lines (for paths and hedgerows), and point markers directly on the map. For a full guide on drawing areas, see How to Create and Edit Areas on the Map.
Common Questions
The Ordnance Survey layer only appears when you are zoomed in far enough. Zoom in closer and the option will become available in the map style picker.
The full map with drawing tools and style switching is available on the web app (in a browser). The mobile app shows assets on a map for fieldwork, but the detailed map management features are best used on a computer or tablet.
Open the Map, type the resident's postcode or street name into the search bar, and the map will jump to that location. Switch to Satellite view if you need to match what they are describing to what you can see on the ground. From there you can find the asset and raise a defect or create a job.